The SAP standard transaction CN43N displays a list of WBSs with overview information of each one.
In the selection screen, you have to select the profile for logical database to be used, clicking in the button “Other DB profile”. The standard one is 000000000001 to view project definitions structurally, but you can choose a custom one if you have for your installation.
The election of the data profile can determinate the fields you will have in the selection screen.
When output report is shown you can navigate to WBS or Project Definition (CJ20N) clicking in the corresponding field.
Also the information can be downloaded to local file with following menu option:
Menu Evaluation->Export->Local File.
Showing posts with label Reporting. Show all posts
Monday, April 30, 2012
Sunday, April 29, 2012
Reporting - Cost Centers Variance, Actual vs Plan costs
With the standard Controlling report S_ALR_87013611 (Cost Centers: Actual/Plan/Variance) is displayed Actual vs Plan costs for a specific periods and plan versions.
In the selection screen is filled the Controlling Area, Fiscal Year, Periods, Plan Version to use, Cost centers group/Cost centers (optional) and Cost Elements group/Cost elements (optional)
Report Output:
Initially in the left box you can see the Cost Centers or Groups listed with the parameters you entered previously. You can choose whichever at level you want.
In the right box the information of plan costs, actual costs and variance are shown at cost element level. It is shown a block with the debit values, then a block with the credit values and the corresponding summarization levels.
The Over/Underabsorption sum level is the difference between the debit and the credit. If credit is greater than debit there is overabsortion, if debit is greater that credit there is underabsortion.
After that, a block with Statistical posting is shown if they are found with the selection criteria chosen previously.
The same occurs with the following block, Parked Posting, if there are Vendor parked invoices with the criteria entered, the value is displayed. You could navigate to invoice details doing double click in the value.
The following information group, Parked Posting, displays the activity sent to customers cost centers and WBS by the Cost Centers of the report.
And finally, Statistical Key Figures block is the total SKF in the cost centers of the report.
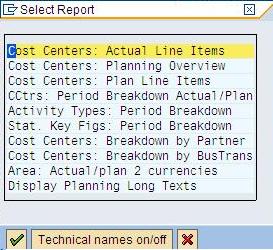
In each moment you can select a line (item or total line) with doubleclick to perform further review. Usually the option “Cost Centers: Actual Line Items” is the best one because gives more detail.
Finally, the report results can be exported to excel, there are two ways, depending the report level you want to print:
- Click List->Export->Spreadsheet
- Select “Excel”
- Type the path an name of the output file.
Report Output:
Initially in the left box you can see the Cost Centers or Groups listed with the parameters you entered previously. You can choose whichever at level you want.
In the right box the information of plan costs, actual costs and variance are shown at cost element level. It is shown a block with the debit values, then a block with the credit values and the corresponding summarization levels.
The Over/Underabsorption sum level is the difference between the debit and the credit. If credit is greater than debit there is overabsortion, if debit is greater that credit there is underabsortion.
After that, a block with Statistical posting is shown if they are found with the selection criteria chosen previously.
The same occurs with the following block, Parked Posting, if there are Vendor parked invoices with the criteria entered, the value is displayed. You could navigate to invoice details doing double click in the value.
The following information group, Parked Posting, displays the activity sent to customers cost centers and WBS by the Cost Centers of the report.
And finally, Statistical Key Figures block is the total SKF in the cost centers of the report.
In each moment you can select a line (item or total line) with doubleclick to perform further review. Usually the option “Cost Centers: Actual Line Items” is the best one because gives more detail.
- Click List->Export->Spreadsheet
- Select “Excel”
- Type the path an name of the output file.
The second option is:
- - Click System->List->Save->Local File
- - Select “Spreadsheet”.
- - Type the path an name of the output file.
Subscribe to:
Posts (Atom)